Debugging Interface is the first challenge in the Hardware Exploitation track on Hack The Box. It falls under the Very Easy category and is a great entry point for anyone starting out with hardware-level exploitation and CTF hardware challenges.
The challenge description includes - "We accessed the embedded device's asynchronous serial debugging interface while it was operational and captured some messages that were being transmitted over it. Can you decode them?"
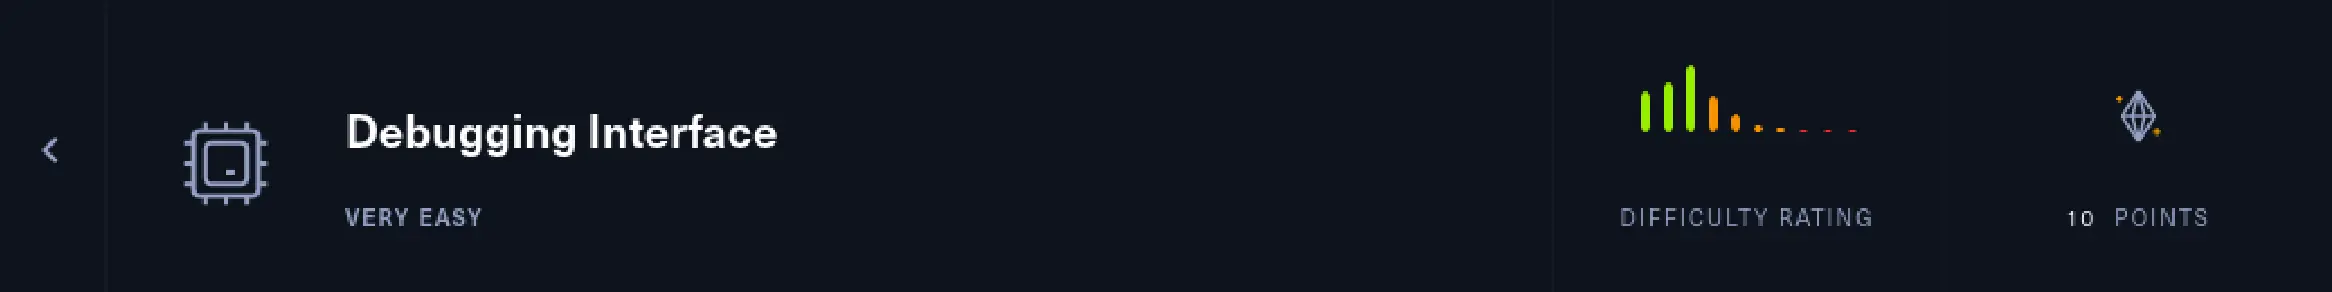
Challenge: Debugging Interface
Category: Hardware Exploitation
Difficulty: Very Easy
Points: 10
Link: Challenge Link
Initial Foothold
We began by downloading the provided file: Debugging Interface.zip. To inspect its contents, we unzipped it using the command below:
unzip Debugging\ Interface.zip
with the password provided hackthebox
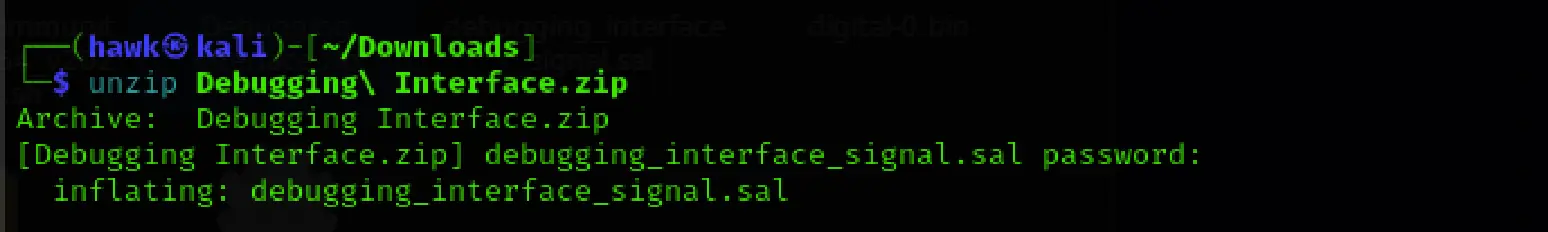
This gave us a single file - debugging_interface_signal.sal.
Sal file extension is a type of file that containing source code written in SQL Application Language. They files are typically script or configuration files used by various software systems. The extension is also used for multiple compressed files.
We unzipped the .sal file as well:
unzip debugging_interface_signal.sal
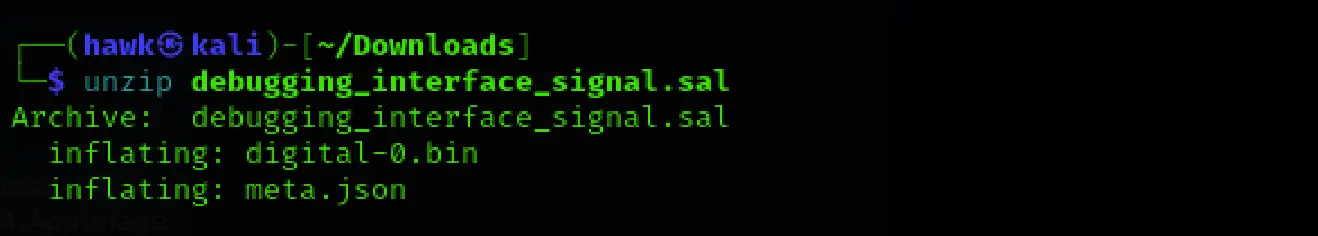
This extracted two files:
- Digital-0.bin
- meta.json
We confirmed their file types using the file command:
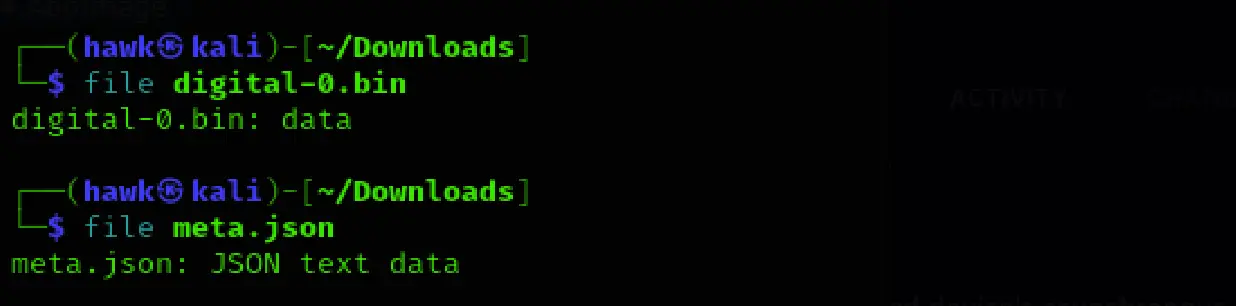
Provided File Breakdown
Digital-0.bin
Digital-0.bin is a binary file containing the raw digital signal data captured on Digital Channel 0 using the Saleae logic analyzer. It’s essentially a stream of binary samples (1s and 0s) representing a hardware line’s state over time — most likely a UART TX line in this case.
We used head to preview the file:
head digital-0.bin
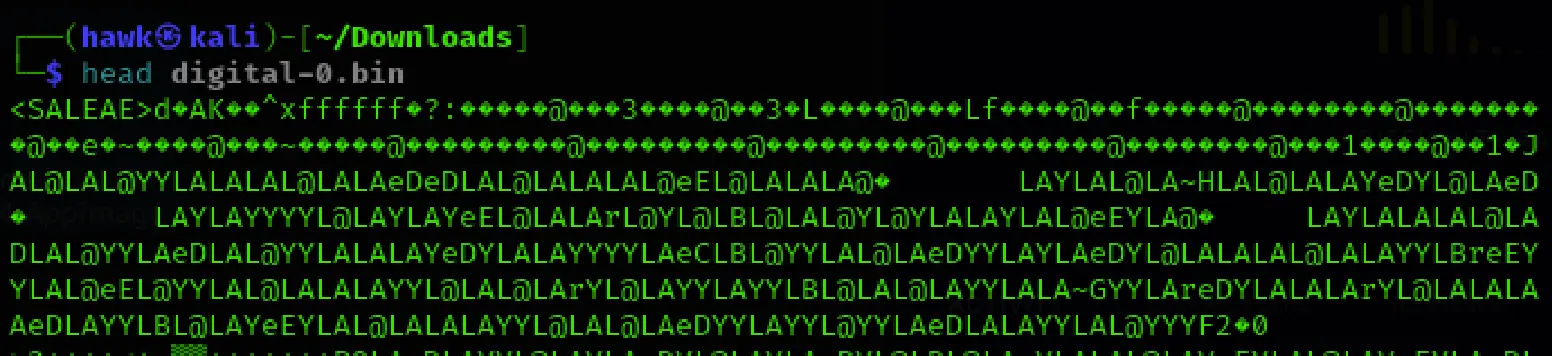
At the very top, we saw the string <SALEAE>. This is known as a magic header — a special identifier used by Saleae Logic software to mark the file as part of its capture format. It helps ensure compatibility when loading files into the application.
meta.json
This file contains metadata about the capture session, formatted in JSON. It doesn’t include any signal data itself but defines how the capture should be interpreted.
We used strings command to view its contents:
strings meta.json
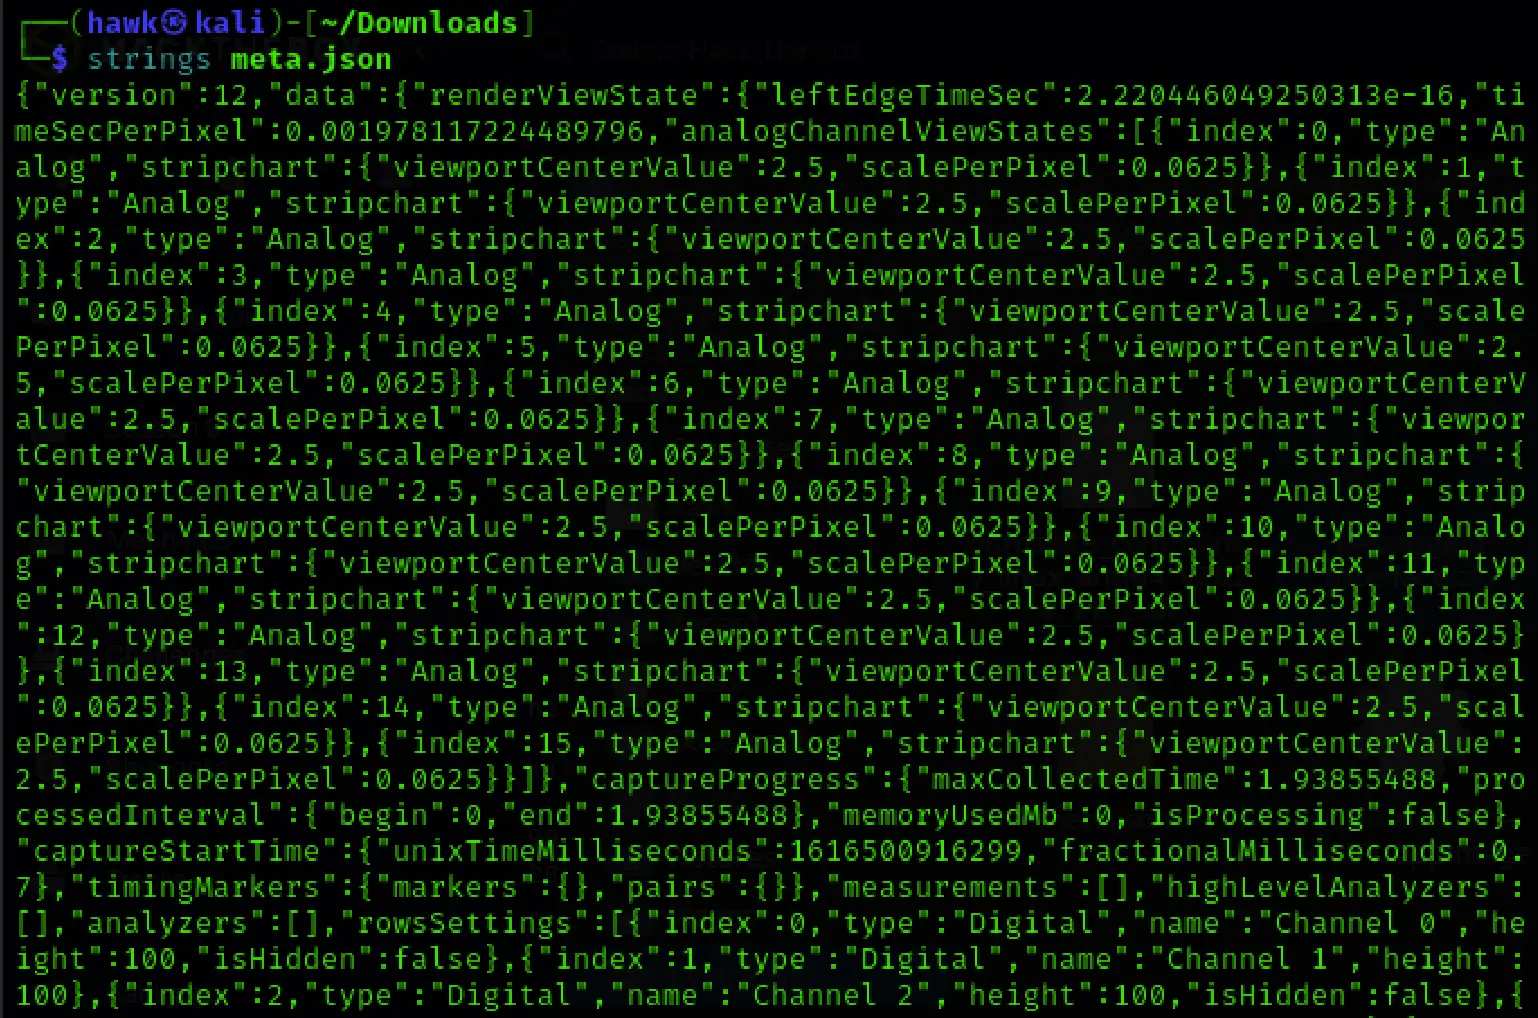
Here’s what the metadata typically includes:
- Sample rate
- View settings and time scale
- Channel mapping and types (digital or analog)
- UI layout (viewport and zoom level)
While meta.json doesn’t directly contribute to decoding data, it’s crucial when reopening the .sal file in Saleae Logic 2, as it ensures accurate visualization and analysis.
Analyzing the Capture
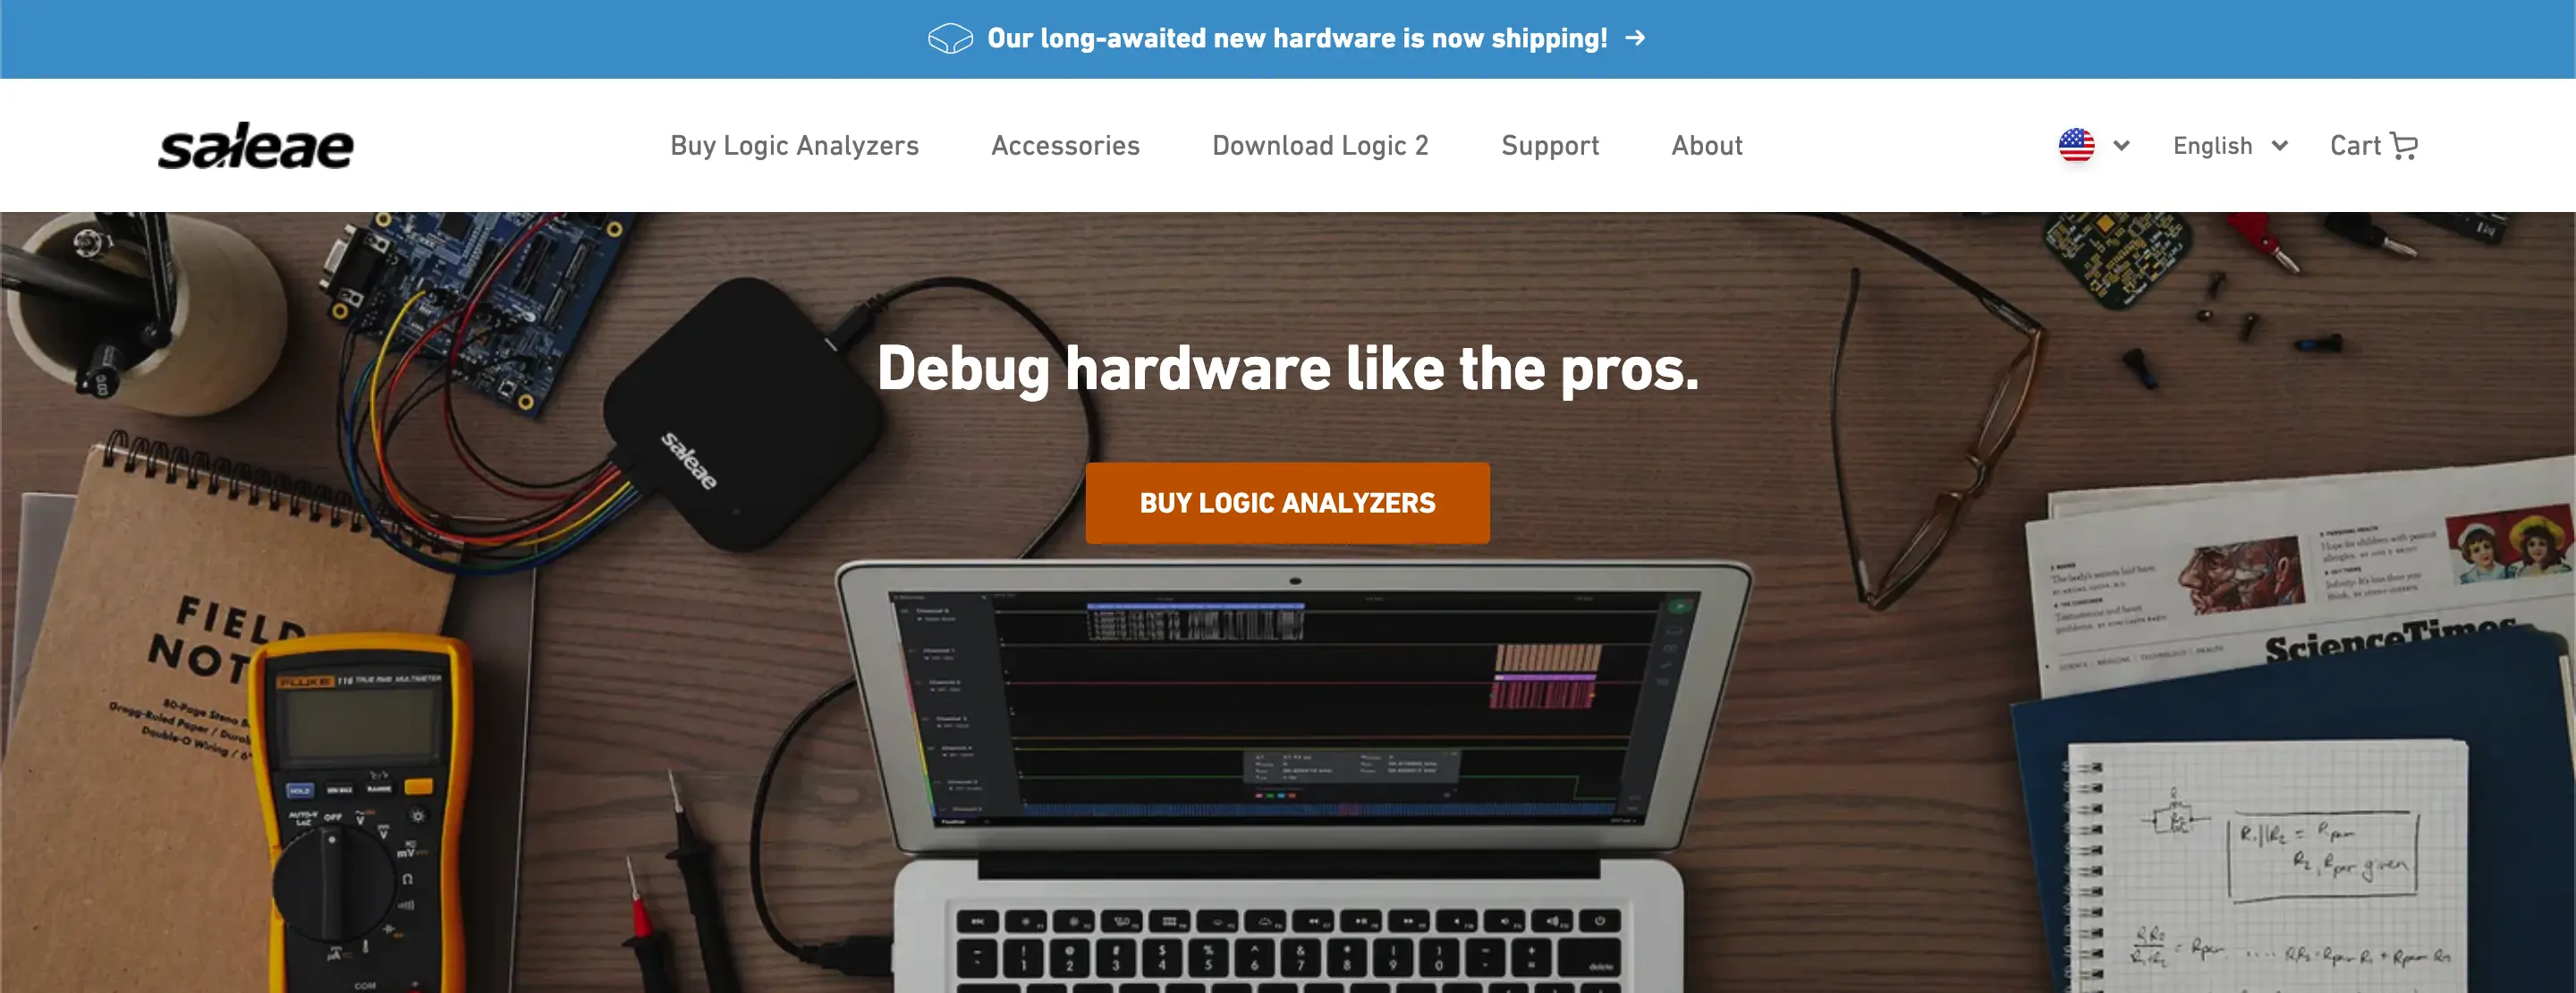
To decode the signal data, we downloaded Logic 2 Software — the official Saleae software for digital signal analysis:
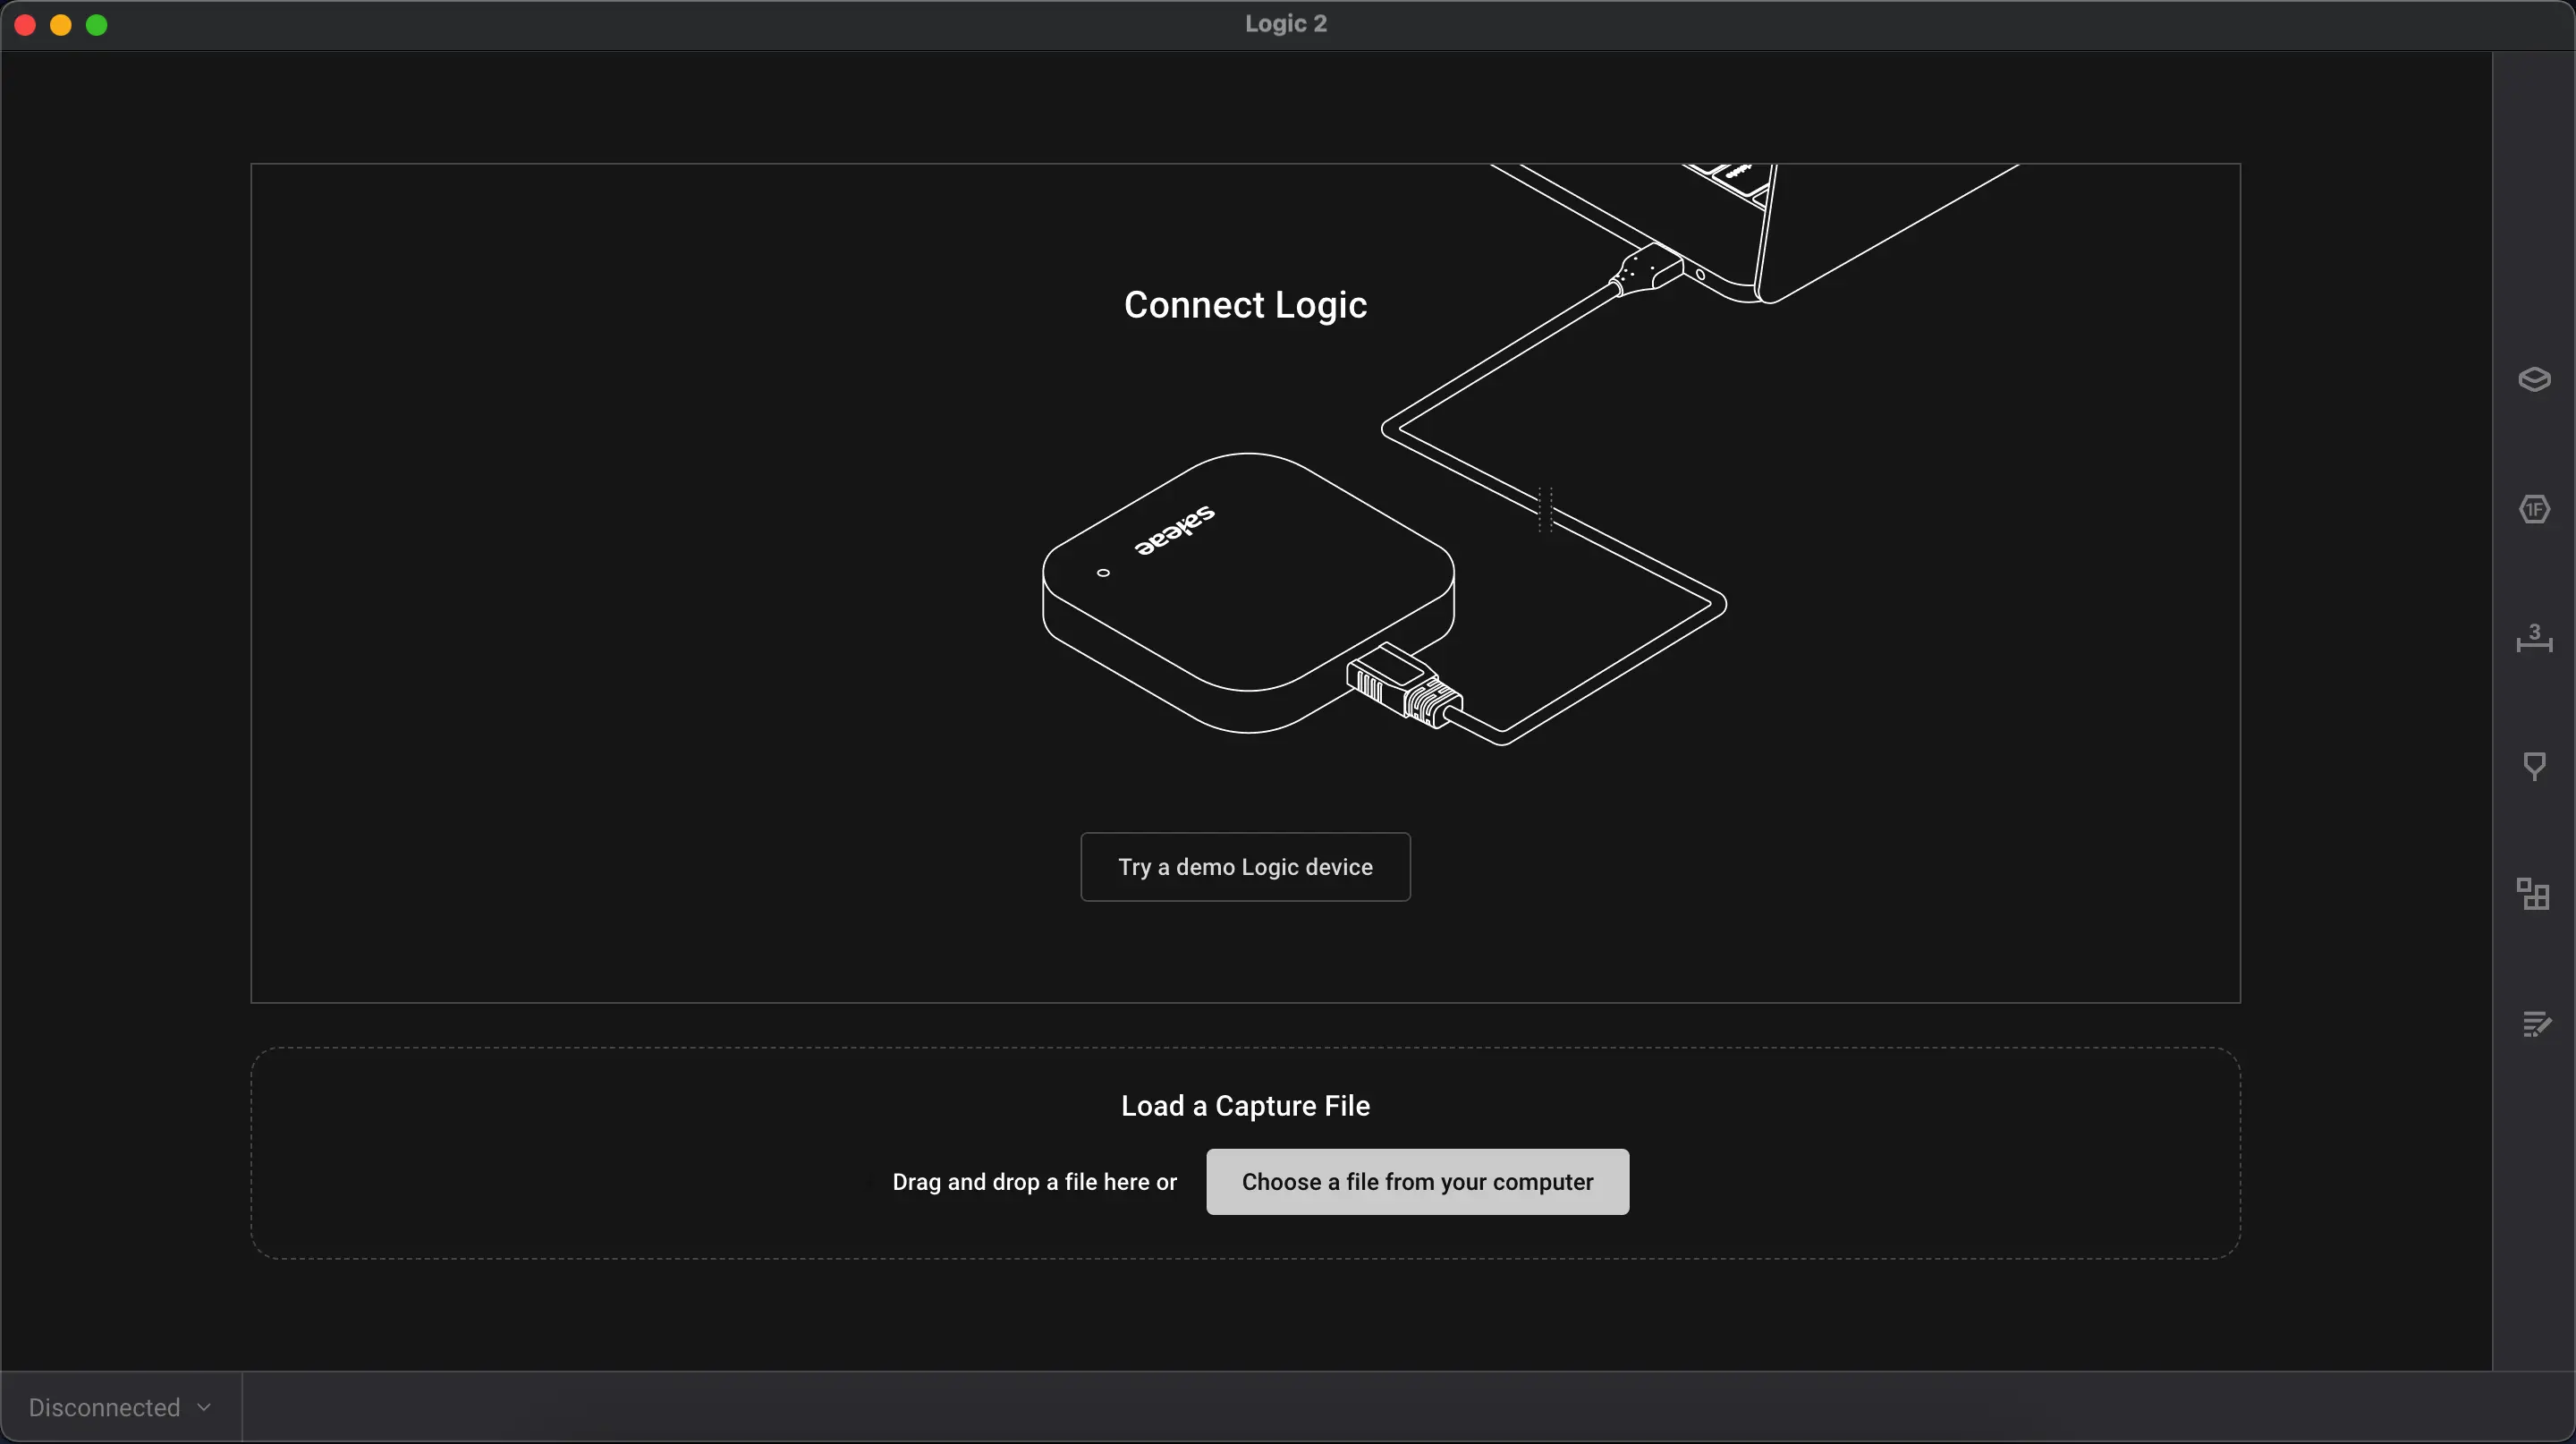
Once installed, we imported the .sal file directly. This loaded both the raw binary data and the associated metadata automatically.
Next, we added a UART Analyzer (also called “Async Serial”) in Logic 2. This allowed us to decode the captured signals into readable ASCII text.
We configured the UART analyzer as follows:
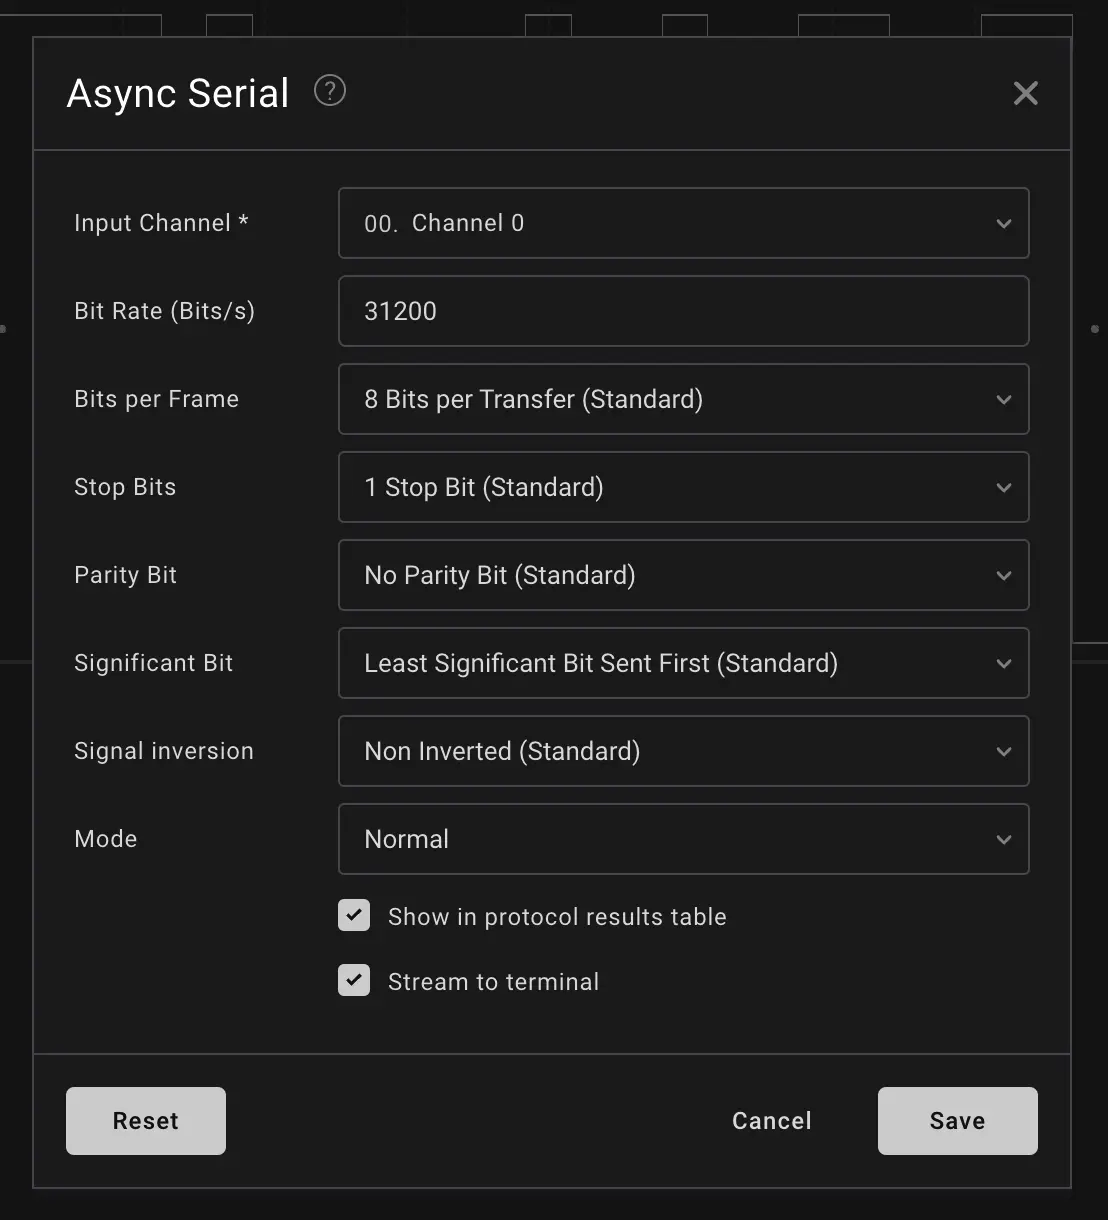
Once configured, we began seeing decoded characters in the data field. We filtered the output and searched for the beginning of the flag — usually starting with HTB{. So, we searched for character H.
To make reading easier, we switched to the terminal view, which displayed the full decoded UART output as a console log.
Eventually, we discovered the flag:
Found flag:
**HTB{d38u991n9_1n732f4c35_c4n_83_f0und_1n_41m057_3v32y_3m83dd3d_d3v1c3!!52}**
Conclusion
The Debugging Interface challenge was a great introduction to the world of hardware exploitation and interfacing with embedded systems. We explored how to analyze raw signal captures, understand UART communication, and decode transmitted data using tools like Saleae Logic 2. The process involved identifying file formats, interpreting metadata, configuring protocol analyzers, and finally extracting meaningful output from the device’s debug interface.
This challenge reinforces the importance of understanding low-level hardware communication protocols, particularly UART, which is commonly exposed in embedded devices and IoT hardware. It also demonstrates how even the most basic debugging interfaces can leak critical information if left unsecured. Mastering these fundamentals paves the way for more advanced hardware analysis and reverse engineering in future challenges.